Welcome to the project

Welcome to the ‘Working across qualitative longitudinal studies’ collection of guest blog posts contributed by experts in the field. We created this collection of blog posts for two reasons. First, we were conscious that accounts of data management and analysis in qualitative research are often sanitised by the time they reach academic journals. We were, therefore, keen to document and share the trials and tribulations and decision-making processes underlying such analysis, thereby contributing to debates around good practice. We also wanted to kick-start conversations about analysis/secondary analysis across large scale and/or multiple qualitative data sets. The guest posts range from early career researchers through to international experts, and address topics as varied as the ethics of using big qual data, using secondary qualitative data and computer-assisted qualitative data analysis software. They profile the diversity of QLR and big qual that is taking place internationally.

The blog collection gathers the experiences and perspectives of those conducting analysis across large-scale, multiple and/or qualitative longitudinal data sets, particularly the re-use of archived material. The possibilities comprise multiple permutations from bringing together two or more archived data sets through to combining archived material with a researcher’s own primary data. Some of the blogs focus on secondary analysis and the re-use of archived data sets, including QLR material, whilst others are concerned with handling large volumes of qualitative data. In both cases the approach undertaken involves, to some degree, engagement with an amount of data that otherwise would be challenging for a single researcher or small team to handle with qualitative integrity

Post#28: Prof Lynn Jamieson, Dr Emma Davidson, Prof Rosalind Edwards and Dr Susie Weller: COVID-19 and ‘Big Qual’

Today’s post is written by Prof Lynn Jamieson along with Dr Emma Davidson (University of Edinburgh) and Prof Rosalind Edwards and Dr Susie Weller (University of Southampton). The blog discusses the potential of qualitative secondary analysis, and in particular ‘big qual’ analysis, for helping to overcome the restrictions placed on qualitative work during the global pandemic. In so doing, Lynn and colleagues draw on a recent ESRC National Centre for Research Methods study – Working across qualitative longitudinal studies: A feasibility study looking at care and intimacy.

COVID-19 and ‘Big Qual’

It seems appropriate to review the possibilities of secondary analysis of data that has already been gathered by face-to-face techniques, as the current pandemic closes down many such forms of research. The substitution of virtual means of data collection for face-to-face means, such as interviewing using internet telephony, is not the only possible response to barriers against tried and tested methods; researchers at or able to return to the design stage might consider the creative possibilities of drawing together existing archived qualitative data for new research. Secondary analysis of qualitative data remains a relatively under used research strategy, despite the accumulation of anonymised, quality-assured and well-documented data that has been carefully curated in official archives having been generated by peer-reviewed, funded and published studies. Researchers seem less able to see secondary analysis as ground breaking and, in the case of qualitative research, heightened sensitivity to the creative connection between researcher and researched builds concerns about ethics and intellectual property.  However, in our published work (Davidson, Edwards, Jamieson and Weller, 2019) we counter these claims and point to the ground breaking opportunities of merging data from several studies in a new data assemblage using a set of steps that iteratively combine breadth and depth.  The way of proceeding that we advocate, helps the analyst to ask new questions, to make theoretical use of comparison and, in the process, extend the generalisability of qualitative research.

Our method is the outcome of a project under the umbrella of the National Centre for Research Methods http://bigqlr.ncrm.ac.uk/ We set out to develop materials that would assist other researchers to remain true to the principles of qualitative research while working with what could be called ‘big qualitative data’ or ‘big qual’ for short – a data assemblage that is much larger than the typical volume of a single project and too large to readily tackle solely by conventional qualitative analysis techniques. We have called our method of ‘big qual’ secondary analysis breadth-and-depth method. In addition to publishing our outline of bread-and-depth method, we have produced a set of resources to help others to use it, teach it and teach with it.  

The four steps in the method are described using an analogy with different stages in an imagined archaeological project. At each step, it may be necessary to return to the starting point or a previous step.

  1. The researcher’s research questions shape the direction of an enquiry-led overview of archived qualitative research using meta data about the archived data sets. This is equivalent to an archaeologist using photographs taken in an aerial survey to select ground for further scrutiny.
  2. Computer-aided scrutiny using means of text searching that are sometimes called ‘data mining’ – although the techniques involved are surface sifting and mapping the breadth of the selected data collections rather than mining depth.This is like the archaeologists’ ground-based geophysical survey on the surface of an area to assess what merits closer investigation by digging.
  3. Analysis of multiple small samples of likely data, equivalent to digging shallow ‘test pits’ to find an area worthy of deeper excavation.
  4. In-depth analysis of the selected sample, using techniques and processes drawn from the repertoire familiar to qualitative researchers. This is the equivalent to archaeological deep excavation.

Our own demonstration project worked with the Timescapes archive https://timescapes-archive.leeds.ac.uk/  Because we were interested in possible convergence by gender in the language and practice of care and intimacy over time, we re-assembled data from across four projects into age cohorts of men and women. This new data set is now available for teaching purposes.  As a follow on of our original project we worked with experts in pedagogy, Melanie Nind and Sarah Lewthwaite, in order to develop training the trainer materials to assist research methods teachers.  Our publications and links to teaching resources can be found at http://bigqlr.ncrm.ac.uk/resources-3/

References

Davidson, E., Edwards, R. Jamieson, L. and Weller, S. (2019) Big data, qualitative style: a breadth-and-depth method for working with large amounts of secondary qualitative data, Quality & Quantity, 53(1), 363-376.

Post#27: Dr Emma Davidson, Justin Chun-ting Ho and Prof Lynn Jamieson: Computational text analysis using R in Big Qual data: lessons from a feasibility study looking at care and intimacy

Today’s post is written by Dr Emma Davidson, and her colleagues Justin Chun-ting Ho and Professor Lynn Jamieson in Sociology at the University of Edinburgh. The blog considers the potentials and pitfalls of using R, a tool for computational text analysis, to get an overview of a large volume of qualitative data and to identify areas of salience to explore further. Emma and colleagues draw on a recent ESRC National Centre for Research Methods study – Working across qualitative longitudinal studies: A feasibility study looking at care and intimacy – conducted by Prof Rosalind Edwards, Prof Lynn Jamieson, Dr Susie Weller and Dr Emma Davidson.

Computational text analysis using R in Big Qual data: lessons from a feasibility study looking at care and intimacy

The use of computational text analysis has increased rapidly across the humanities and social sciences. Much of this growth has centred on taking advantage of the breadth of new digital sources of data and the rich qualitative material they provide. Despite this progress, the application of these approaches to qualitative methods in the social sciences remains in its infancy. Our project is one such endeavour. Together with colleagues – Professor Rosalind Edwards, Dr Susie Weller and Professor Lynn Jamieson – it involved secondary analysis of six of the core studies stored in the Timescapes Qualitative Longitudinal Data Archive. Using a substantive focus on practices of care and intimacy over time, and across the life course, we wanted to explore the methodological possibilities of working with large volumes of qualitative data. We also wanted to address the scepticism that ‘scaling up’ could damage the integrity of the qualitative research process.

The breadth-and-depth method

From the outset, our intention was to develop an approach, which integrated computer-assisted methods for analysing the breadth of large volumes of qualitative data, with more conventional methods of qualitative analysis that emphasise depth. This would – we hoped – take us away from the linearity implied by ‘scaling up’, towards an iterative and interpretative approach more akin to the epistemological position of the qualitative researcher. A discussion of our breath-and-depth method is detailed in Davidson et al. (2019). One of our first analytical steps was to ‘pool’ the data into a new assemblage classified by gender and generation-cohort. Too large to read or analyse using conventional qualitative research methods, we looked to computer-assisted methods to support our analysis. What we were seeking was a way of ‘thematically’ mapping the landscape of the data. Rather like an archaeologist undertaking geophysical surveying, we anticipated using this surface survey to detect ‘themes’ for further exploration. Once identified, these themes would be analysed using shallow test pit sampling, the aim of which is to ascertain if they are worthy of deeper investigation. We expected a recursive movement between the thematic mapping and the preliminary analysis. So, where a possible theme proved to be too ambiguous or tangential, it would be eliminated, followed by a return to the thematic mapping to try again. If a theme(s) relevance is confirmed, the move to in-depth interpretive analysis can be made.

Thematic mapping and computer-assisted text analysis

There are, of course, various ways of undertaking computer-assisted approach to thematic mapping. And as part of the project we experimented – more and less successfully – with various text analytics tools, including Leximancer, Wordsmith, AntConc and R. In each, we were broadly interested in text analysis, exploring for instance word frequencies, word proximity and co-location, conducting searching for words within pre-defined thematic clusters (for example, relating to performing practical acts of care and intimacy), as well as keyword analysis.

We wanted to explore R since it provided the ability to write the programming language ourselves and change the form of analysis according to any emergent results. This not only meant that we were in control of the programming steps, but also that these steps were transparent and understood. The limitation – of course – is that we were a team of researchers whose skills were primarily in qualitative data analysis! And while we were capable of undertaking statistical analysis, we had no prior experience of statistical programming languages, nor of natural language processing. It became clear that in order to proceed we didn’t just need a skilled R user to produce the analysis for us, but a collaborator who could go on this journey with us. This proved a difficult task since the majority of those we approached were skilled in computational methods, yet were not familiar or sufficiently interested to collaborate in a project where the focus was on qualitative research methods. This reluctance perhaps reflects the tendency for qualitative methods to use small-scale and intensive approaches which focus on the micro-level of social interactions. Computational scientists, conversely, have focused on big data to understand social phenomena at an aggregate level. By seeking to bring these skills together, our study presented possible collaborators not only with an unfamiliar form of data, but also an unfamiliar approach.

Using R to analyse Big Qual data

We were – eventually – lucky enough to recruit Justin Chun-ting Ho to the project, a doctoral candidate from the University of Edinburgh and in collaboration we developed a plan for the proposed work. A priority was to conduct a comparative keyword analysis to identify ‘keyness’ by gender and generation cohort. We were also keen to ‘seed’ our own concepts by creating pre-defined thematic word clusters, and examining their relative frequency across the different categories of data. How does the frequency of positive emotion words, for example, compare between the youngest and oldest men?

Using keyword analysis, we were able to gain both general insights, as well as potential areas for further exploration. We found, for example, that relationship and emotion words occurred with a greater frequency amongst women, as did words related to everyday or practical acts of care, such as ‘feed’ and ‘dress’. Conversely, we found that words relating to work and leisure activities were most common amongst men. Changes across the life-course were also noted, with family – predictably – becoming more salient feature of life for older generations. As an example, the figure below shows a comparison of the oldest and youngest women, and the shifting focus from friends to family.

 Figure 1: Comparative keyword analysis: pre-1950 (oldest) versus post 1990 (youngest) women

We were also, however, aware that the results reflected the complexity of speech itself (for example, the meaning of ‘care’), while some concepts were structured strongly by individual projects (for example, the frequent use of siblings was, to a large extent, a function of its prevalence in one of the core Timescapes projects, rather than coming from naturally occurring speech). It also raised the question of the extent to which examples of care and intimacy were neglected due to the parameters used to define keyness – that is, we were looking at the keyness of all words, not just those words related to care and intimacy.

These reflections were themselves useful since it provides us an opportunity to critically evaluate the tacit theory underpinning our understandings of what constitutes practices of care and intimacy. Where we benefited from R was in its flexibility, since we were able to explore a range of alternate forms of analysis to integrate further. For example, we went on to manually identify care and intimacy keywords, and to combine them into thematic ‘clusters’ that share some characteristic (for example, conflict words, relationship work, words describing practical acts of care and words describing formal childcare). We then counted the frequency of words from each cluster using R to show the thematic differences between interview transcripts of different genders and generations. In this way, we were able to augment human effort with the power of machine; qualitative analysis allowed us to identify the themes while computational techniques could show the prevalence of such themes within the corpus, which would otherwise be too big for qualitative analysis. This thematic analysis, in turn, provided further outputs, which identified specific themes (including ‘love’ and ‘arguments’ for exploration through shallow test pit analysis, see Davidson et al. 2019).

Reflections and moving forward

The project, overall, has shown that text analytics can provide a unique opportunity for qualitative researchers seeking to interrogate large volumes of qualitative data. We concur with Gregor Wiedemann’s contribution in this collection that these methods can extend and complement the qualitative researchers’ toolkit. Our work with R has provided tangible benefits, and crucially supports the breadth-and-depth approach developed by the project. However, unlike pre-programmed and commercially available software such as Leximancer, R requires a certain level of competency in statistical programming language – and crucially the time and resources to invest in developing these skills. It is perhaps for this reason that our analysis ultimately relied on Leximancer, and its accessible, user-friendly interface.

Qualitative researchers are not unique – many social scientists, regardless of methodological orientation, do not have these skills. Yet given the rise of big data and possibilities it offers the social sciences, the value of text analytics is likely to grow – as will demand for its application. To bridge this chasm, investment is needed in training, capacity building and multi-disciplinary working. The method developed through our project provides one such way of building this interdisciplinary bridge. However, it also revealed the importance of developing text analytic skills directly into bids for funding – either through a named collaborator equally invested in the project outcomes, or sufficient resources for the training and development of the team. Looking forward, we anticipate with excitement the collaborative opportunities that the ‘big data’ era presents to qualitative researchers.

References

Davidson, E., Edwards, R., Jamieson, L. and Weller, S. (2019) Big data, Qualitative style: a breadth-and-depth method for working with large amounts of secondary qualitative data. Quality and Quantity. 53(363): 363-376.


Post#26: Dr Susie Weller: Collaborating with original research teams: Some reflections on good secondary analytic practice

In this blog, Dr Susie Weller, Senior Research Fellow at the ESRC National Centre for Research Methods and the MRC Lifecourse Epidemiology Unit, University of Southampton reflects on her experiences of thinking about good practice in qualitative secondary analysis. Susie draws on a recent ESRC National Centre for Research Methods study – Working across qualitative longitudinal studies: A feasibility study looking at care and intimacy – conducted with Prof Rosalind Edwards, Prof Lynn Jamieson and Dr Emma Davidson. She considers some of the possibilities and challenges of developing collaborative relationships between secondary analysts and members of the original teams who created the data sets. In so doing, she shows how attachments to data and notions of ownership – for both original researchers and re-users of the data – shift over time.

Collaborating with original research teams: Some reflections on good secondary analytic practice

With colleagues, I have been conducting secondary analysis across six of the core studies housed in the Timescapes Qualitative Longitudinal Data Archive. The Timescapes project sought to scale up qualitative longitudinal (QLR) work. It was a five-year study comprising a set of empirical projects documenting change and continuity in identities and relationships over the lifecourse. The initiative also pioneered new approaches to archiving and re-using QLR data. Seven teams from five Higher Education Institutions in the UK conducted the original studies. As a secondary analysis team, we came to these data sets not just as secondary analysts, but also primary researchers. I conducted one of the Timescapes studies – Siblings and Friends – with Rosalind Edwards, and Lynn Jamieson was part of the Work and Family Lives project . Not only did this connection help us understand better the origins of the data, but it also facilitated relationships with the original researchers.

Having been heavily invested in our own QLR studies, we were mindful of the very particular nature of the long-term connection between researchers and participants. Our perception was that even though the original teams had archived their data for the purpose of re-use, we ought, in our negotiations about the secondary analysis of their material, to be sensitive about such long-term connections and the emotional investment made by the researchers. For us, our initial ideas about good secondary analytic practice involved developing approaches to sustained collaboration with the original researchers. Of course, some secondary analysts might regard the engagement of primary researchers as an interference, instead viewing the data as embodying new knowledge or alternative insights, which do not require the explicit involvement of the original researchers. Our approach was guided by a duty of care, and was shaped by our own understandings of the temporal and emotional investment involved in QLR.

With these concerns in mind, we contacted former Timescapes colleagues at the outset to inform them of the purpose of our study and our plans to use their archived material. In the early stages, we liaised with individuals via email, asking project-specific questions about, for instance, the research context, data set structure and their own analysis. Whilst our intention was to be inclusive, in practice we liaised with only one or two members of the original team; those with whom we had strong professional relationships. Later, we took a more formalised approach inviting members of the original teams to complete an online consultation with questions asking them about their changing connection to the data, feelings and concerns about data sharing and re-use, and the forms of consultation or connection (if any) they would consider appropriate/valuable. We received responses from all teams over varying timescales, some of whom have contributed to our series of guest blogs. Most of the responses were from the researchers who had produced the data.

Their willingness to contribute to our work on good practice in qualitative secondary analysis may be regarded as acts of cooperation and we have relied heavily on the goodwill of these colleagues, some of whom we have known for many years. In 2017, with NCRM colleagues Melanie Nind and Sarah Lewthwaite, we were awarded additional funding to build capacity and develop resources for the teaching of our new breath-and-depth approach to big qual analysis. This opportunity enabled us to work more closely with some of our former colleagues through action-oriented training events. We have since shared details of the resources produced via our final correspondence with the original teams.

We soon came to realise that, whilst our initial ideal was to foster sustained collaboration, this was not something that the original researchers necessarily wanted, expected or could accommodate. Some had left academia for new ventures, or were not available. Others had developed different interests and had moved on from their Timescapes work. Few were still using their own project material. Our consultation revealed that of the 19 who responded to a question about their connection to the data, seven explicitly stated that their attachment had declined over time (one person reported having never felt any connection). Furthermore, of the 14 who replied to a question asking their opinion on appropriate levels of contact between original researchers and secondary analysts, three did not want any contact at all. Conversely, our engagement with material from studies other than our own gave us a greater (and growing) sense of connection to the broader Timescapes collection.

Whilst original team members may wish to collaborate they may not have the time or funds to do so. Yet, it may well be junior/field researchers who are best placed to enlighten secondary analysts on the minutiae of a project. We were, however, concerned that sustained collaboration, which relies largely on the goodwill of colleagues, could result in exploitation. It is important to acknowledge the hidden labour involved in such collaborations and to think through the possibilities for formalising the process to some degree. This could involve a variety of options from acknowledging the investments of data generators in project outputs through to developing joint ventures, or incorporating willing original researchers in grant design and budgets. This might be particularly appealing for fixed-term contract researchers.

That said our consultation showed that some of our Timescapes colleagues felt increasingly detached from ‘their’ archived data over time, whereas we became more attached to it. We merged data from the six projects into one assemblage organising the material by gender and cohort-generation. This was a time-consuming process and we engaged with the data over the course of four years, albeit on a part-time basis. The labour we invested in this process meant that we became attached to it as our production, thereby shifting our perception of ownership. Indeed, we are currently in the process of preparing our data assemblage for deposit in the Timescapes Archive as a teaching data set. Archiving and data re-use implies that the knowledge production has not ended. Secondary analysis disrupts usual understandings of collaboration introducing it as emergent, iterative, unexpected.

Post#25: Dr Susie Weller, Prof Rosalind Edwards, Prof Lynn Jamieson and Dr Emma Davidson: Selecting data sets to create new assemblages

The focus of today’s blog is on the process of identifying qualitative material from multiple archived data sets to bring together to conduct secondary analysis. This process is the first stage in a four-step breath-and-depth method we developed for analysing large volumes of qualitative data. We draw on our experiences of conducting the ESRC National Centre for Research Methods project, of which the Big Qual Analysis Resource Hub is an outcome. Utilising different qualitative longitudinal research (QLR) data sets housed in the Timescapes Archive, our project aimed to explore the possibilities for developing new procedures for working across multiple sets of archived qualitative data. The blog is based on our forthcoming chapter in Kahryn Hughes and Anna Tarrant’s book ‘Advances in Qualitative Secondary Analysis’ (Sage).

Selecting data sets to create new assemblages

The availability of volumes of complex qualitative data for secondary analysis is growing. Indeed, major research funding bodies in the U.K. regard the sharing of data as vital to accountability and transparency and, for some, it is a contractual requirement. Furthermore, the increasing influence of big data, which has until now, generally concerned large-scale quantitative data sets, highlights the potential for researchers to enhance further the value of existing qualitative investments. Yet, the full potential of archived qualitative has yet to be realised.

The development of central and local digital repositories opens up exciting possibilities for doing new research using existing data sets. With that comes the opportunity to bring together one or more data sets into a new assemblage in order ask new questions of the data, make comparisons, explore how processes work in different contexts, and provide new insights.

Major contemporary online qualitative archival sources established internationally for data preservation and sharing include (see also the Registry of Research Data Repositories):

Many of these data repositories have been designed with re-use in mind and material is accompanied by documentation about the original project such as: aims and objectives, the methodology, sample and methods, and units of analysis, as well as file types and formats; in other words, descriptive, structural and administrative ‘meta data’ about the data set. Registration, including signing an ‘end user’ agreement or licence, is usually a requirement prior to gaining access and downloading data sets. Such agreements often contain clauses around the use, storage and sharing of data.

Identifying appropriate qualitative material for a given project involves exploring the data that is available in an archive or across several archives. You could bring together data from many different projects housed in one archive, as we have done. Alternatively, data sets from different repositories could be synthesised, or you could search for archived material to bring into conversation with your own data.

The aim of this initial search is to gain a precursory understanding of the nature, quality and ‘fit’ with the research topic of the available small-scale data sets. We saw parallels between this process and that of an archaeologist’s aerial survey. We felt we needed to fly systematically across a data landscape to get a good overview. This part of the process is likely to be time-consuming. It can be wide-ranging, for example, locating data sets on a broad topic area, or it could be quite narrow, focused on searching for data to fit a specific substantive issue or set of research questions. As part of this initial identification of data sets we found it useful to explore some of the outputs produced by the original researchers.

The process of searching within a given archive varies. The UK Data Service (UKDS), for instance, features the ‘Discover’ search function for reviewing their data catalogue, which includes the option to filter for qualitative data sources.  The search function in the Timescapes Archive allows browsing by project, concepts or descriptive word, enabling searches by criteria such as gender, employment status etc. This approach does rely on the keywords assigned to each data item by the original research team, so there may be data that is of interest that does not come up on a descriptive word search. New forms of searching are currently in development. In archives such as ‘Qualibank’, accessed via the UKDS, detailed searches can be conducted across the content of the entire collection, although at present this comprises only a small collection of classic studies. Using international archives can raise further challenges of searching for terms in different/multiple languages or making appropriate translations.

Searches within an archive(s) are guided by the researchers’ own questions, research topic, and the geographic or linguistic context and these help in the process of deciding which data sets or which parts of multiple small-scale data sets, to include or exclude from the larger, combined data set to be constructed, that we have referred to as our data assemblage. This unique assemblage can be viewed as a new data set, with its own methodological history and the potential to be curated and used by other researchers.

In our study, we surveyed the parameters of six of the core data sets deposited in the Timescapes Archive. We initially kept the six projects separate in order to get a sense of the scope and nature of each the data sets. We mapped the studies, explored the state and volume of the data, viewed any contextual material and metadata available, logged the research tools used, and gained an overview of the substantive emphasis of each project. We then used the qualitative analysis software, NVivo, to help us manage the volume of data and decided, as part of this process to harmonise file names to aid retrieval and the reorganise the files from their original data sets into new groupings – gender and cohort generation – based on our substantive focus and chosen unit of analysis for cases. It was at this point that the individual datasets were merged into our new data assemblage. You can read more about our breath-and-depth method for qualitative analysis in our paper: Big data, qualitative style: a breadth-and-depth method for working with large amounts of secondary qualitative data, Quality & Quantity, 53(1): 363–376. We have also made available our data assemblage in the Timescapes Archive (coming soon).


Guest post#24: Dr Åsa Audulv: Be transparent (and proud) – How can we better describe the practice of qualitative longitudinal analysis?

Dr Åsa Audulv, lecturer in the Department of Nursing Science, Mid Sweden University, Sweden and School of Occupational Therapy, Dalhousie University, Canada has written today’s guest post. Åsa has conducted qualitative longitudinal research (QLR) into self-management among people with long-term health conditions. With colleagues she is currently working on a literature review of QLR methods and in today’s post she draws on their preliminary findings to highlight the lack of transparency around approaches to QLR analysis in health research publications.

Be transparent (and proud) – How can we better describe the practice of qualitative longitudinal analysis?

About 12 years ago I started a QLR project as part of my PhD work. At that time, I knew little about the traps, tricks and rewards of longitudinal analysis. I basically had the idea that our phenomenon of interest – the self-management of long-term health conditions – changed through an individual’s illness trajectory and, because existing research heavily relied on one-time interviews, I thought a longitudinal design would provide more insight. In short, data collection with four interviews per participant, spanning over two years seemed like a design that could contribute new knowledge. I understood that this design could result in around 70 interview transcripts to analyze and, at that time, I only had vague ideas about how that analysis might be conducted.

Over the past year I have been working with colleagues on a literature review concerning different methodological approaches to QLR analysis. Our inclusion criteria have been articles within the field of health research, collecting qualitative data at several time-points. After reading 52 articles one thing that surprised us was how little was conveyed about the longitudinal aspects of the analysis. In total, 57.6% (30 articles) did not mention how they had managed the longitudinal aspects. For example, they did not say anything about time point, change, or comparison over/through time-points in their analysis section. Since, the body of QLR work is small in comparison to qualitative studies it is possible that many authors were more used to describing approaches to analyzing one-time data-collection studies and therefore did not really know how to outline the longitudinal aspect in their analysis. The limited amount of methodological literature might also add to this uncertainty. Further, it is possible that most peer-reviewers of QLR papers are experts in the substantive focus of the work, rather than on QLR methodology, so they might not spot this aspect during the peer-review process. There might also be pragmatic reasons, like limited space available. However, the fact that QLR studies are complicated and relatively unusual would add to the importance of explicit analysis descriptions regarding how such analysis was conducted.

In our review, 22 articles (42.3%) had some description of how they analyzed the longitudinal aspect. However, the clarity and depth of the descriptions varied. Some described the longitudinal aspect as an integrated part of their whole analysis. These projects were often centered around investigating change. They typically described their analysis in several steps where the longitudinal aspects were included in almost every step. For instance, Johansen and colleagues (2013) conducted a study about addicted individuals’ social motivations and non-professional support. In their description of the analysis the longitudinal aspect was well integrated (the bold indicates the longitudinal aspects):

“
, we first conducted an open coding of the data from phase 1 and phase 2. Next, we used the framework analysis method to track changes over time [33], and facilitate axial coding and constant comparison. Relationships between the codes were explored throughout all three phases of the study and individual changes were covaried with dyadic events and events involving relationships with other people representing network support for either using or non-using. As such, narrative analyses were conducted for all dyads to capture details about the support process and its consequence for recovery. In this way, we were able to describe the support dynamics of each dyad, explore how the support was influenced by characteristics of the individual members and support arrangement, and theorize about the ways this affected recovery. In addition to the tracking of thematic changes, we also utilized proportions as indicators of change [34]” (Johansen, 2013, p.233)

Other studies described the longitudinal aspects as one isolated step, often at the end of the analysis description. This suggests that the first part of the analysis had been conducted with a focus on the phenomena with  the longitudinal aspects brought in at a later stage to deepen the understanding and/or add another perspective. For example, do Mackintosh-Franklin et al (2014) describe:

“Findings from each interview stage were analyzed separately, and only after separate analysis had taken place were both data sets combined for final analysis. Findings reported below are from the two final stages of this analytical process, using separate and combined interview sets.” (Mackintosh-Franklin, 2014, p.202)

Some articles mentioned a longitudinal dimension to the analysis, but were not specific about how that analysis was conducted. For example, Salter et al (2014, p.2) describe: “Iteration between both data sets and the research literature helped inform the analysis at the explanatory level.” Several studies described the use of tools and/or analysis strategies that are often employed for analyzing longitudinal aspects. For example, matrices, flow charts, and/or comparing across parts or interviews. Some described these tools and analysis strategies clearly. However, it is more common that they are mentioned in passing and the reason and outcomes of using these practices remain unclear. For example, one article mentioned the use of matrices but did not describe if those matrices were compared to time-points, cases or both.

In conclusion, as the other blogs in this collection have shown, there are different ways to analyze QLR data, and thus different ways of describing the qualitative longitudinal aspects of analysis. First, we need to be clear about what aspects of a project are longitudinal and how we are going to analyze them. Secondly, by being transparent in our description of how we conduct the analysis we can make our approach and our justification for that approach clearer. In turn, that will make it easier for our readers to evaluate the quality of our work. In our review, 57.6% of the articles lacked a description of how they analyzed time in their QLR. I would argue that would be 30 articles too many. A third reason to clearly describe the longitudinal aspects of an analysis is to raise awareness of our work. We should be proud of the approach we use. QLR opens up a wide range of possibilities. It can help us better describe our phenomena of interest, and collect richer data. By writing a succinct analysis section we are giving an example of how it can be done, teaching others about QLR, and showing the merits of such approaches. My longitudinal data collection lasted for two and a half years and included 81 interviews that generated 726 single-spaced transcribed pages. Eventually, it was presented in two research papers (Audulv, Asplund, Norbergh, 2012; Audulv, 2013) and I still think it was a rather cool project.

You may also be interested in Åsa’s  2019 paper, co-authored with  Åsa Kneck, in Nursing Inquiry  – Analyzing variations in changes over time: development of the Pattern-Oriented Longitudinal Analysis approach. 

References:

Audulv, Å., Asplund, K. and Norbergh, K-G. (2012) The process of self-management integration. Qualitative Health Research. 22(3), 332-345

Audulv, Å. (2013). The over time development of chronic illness self-management patterns: a longitudinal qualitative study. BMC Public Health, 13:452

Johansen, A.B., Brendryen, H., Darnell F.J. and Wennesland, D.K. (2013). Practical support aids addiction recovery: the positive identity model of change. BMC Psychiatry 13:201

Mackintosh-Franklin C. (2014). The Impact of Experience on Undergraduate Preregistration Student Nurses’ Responses to Patients in Pain: A 2-Year Qualitative Longitudinal Study. Pain Management Nursing, 15, (1): 199-207

Salter C, McDaid L, Bhattacharya D, Holland R, Marshall T, et al. (2014) Abandoned Acid? Understanding Adherence to Bisphosphonate Medications for the Prevention of Osteoporosis among Older Women: A Qualitative Longitudinal Study. PLoS ONE 9(1): e83552.


Guest blog #23: Prof Jane Gray: Working backwards and forwards across the data: Bringing together qualitative longitudinal datasets with different temporal gazes

 In our latest guest post, Jane Gray, Professor of Sociology at Maynooth University, Ireland, focuses on reconciling different temporalities when bringing together a data set  comprising retrospective life story narratives with a set of qualitative longitudinal interviews from a prospective panel study.

 Jane has expertise in families, households and social change, as well as qualitative data management and sharing. She has completed studies such as Family Rhythms using archived data sets. She has contributed to the development of the Digital Repository of Ireland and is the programme leader for the Irish Qualitative Data Archive.

Working backwards and forwards across the data: Bringing together qualitative longitudinal datasets with different temporal gazes

Bren Neale (2019, p. 20) has contrasted qualitative longitudinal (QLR) methods that prospectively  trace lives through time with approaches to the study of lives that reconstruct them through a retrospective gaze.  Joanne Bornat and Bill Bytheway (2012) showed how different methods of data collection construct different temporalities within QLR. In this blog post I describe how the Family Rhythms project created an interesting opportunity to bring different temporal gazes and temporalities together, in a study funded by the Irish Research Council as a demonstrator project for secondary qualitative data analysis in Ireland.  Inspired by new sociological approaches to understanding family life as configurations, practices and displays, Ruth Geraghty, David Ralph and I aimed to develop a fresh understanding of long-term patterns of family change by bringing retrospective life story narratives from the ‘Life Histories and Social Change’ (LHSC) project together with qualitative interviews collected as part of the first wave of the prospective panel study ‘Growing Up in Ireland’ (GUI).

Because the LHSC study was carried out with three birth cohorts of Irish people (born before 1935, 1945-54 and 1965-74), we initially aimed to treat the GUI interviews (carried out with nine-year old children and their parents) as a fourth cohort (born around 1998). However, we soon found that the different study designs created challenges for this simple ‘additive’ approach.  First, while the LHSC study included a life history calendar instrument to collect retrospective data about the timing of events in participants’ lives, the life story interviews were relatively unstructured, loosely guided by topic and life stage. By contrast, the GUI interviews were semi-structured with questions designed to map on to the broad themes covered within the quantitative panel study.  More significantly, however, it soon became apparent that the different temporal gazes adopted within the studies affected the substantive content of the data.  With their focus on remembering past events, the LHSC interviews (including the formal calendar) look ‘backwards’, whereas the GUI interviews have a pronounced ‘forward-looking’ focus on the children’s anticipated futures.  This was reinforced, in the case of GUI, by additional instruments including, for example, an essay writing exercise that invited the children to imagine what their lives would be like at age 13.  These divergent temporal perspectives affected how people talked about their family lives.  While the LHSC interviewees ‘made sense’ of their family lives by reconstructing them within a biography, the GUI interviewees situated them within everyday practices and contemporary relationships.  Their temporal orientation is anticipatory and aspirational, rather than reconstructive and explanatory.

Of course, these differences were not absolute: many LHSC interviews include narrative segments about hopes for the future, while some GUI parent interviews include reflections on past family lives. Nevertheless, the divergent temporal perspectives of the studies meant that it was not possible to make straightforward thematic or life stage comparisons across cohorts.  We addressed this challenge by adopting a ‘temporal gaze’ within our analysis, in a process that we have described as ‘working backwards and forwards across the data’ (see Gray, Geraghty and Ralph 2013; Geraghty and Gray 2017).  In effect, this meant that we read both with and against the temporal ‘grain’ of the data (Savage 2005), often incorporating different generational standpoints.  This can be seen most clearly in our analysis of the changing relationship between grandchildren and their grandparents.  A reading that begins with children in the GUI study and works backwards across LHSC participants’ childhood memories, reveals an exceptional degree of continuity in the quality of the relationship from the perspective of grandchildren, going right back to the earliest decades of the 20th century.  However, a reading that begins with the childhood memories of the oldest LHSC participants and works forwards through memories and contemporary experiences from the perspectives of parents and grandparents, reveals significant change in the family, household and community contexts within which the grandchild-grandparent relationship was experienced across historical time.  This analytical approach thus yielded new substantive and theoretical insights on the character of long-term patterns of family change.

Our strategy of ‘reading backwards and forwards’ emerged as a way of addressing the challenges presented by our efforts to work across qualitative longitudinal datasets with different temporal gazes and temporalities. However, what started out as a problem turned into an opportunity to develop higher level understandings of long-term patterns of family change by reading with and against the temporal grain of the datasets, illustrating the potential for including divergent temporal gazes within the corpus of QLR.

References

Bornat, J. and Bytheway, B. (2012) Working with different temporalities: Archived life history interviews and diaries. International Journal of Social Research Methodology, 15(4): 291-299.

Geraghty, R. and Gray, J. (2017) Family Rhythms: Re-visioning family change in Ireland using qualitative archived data from Growing Up in Ireland and Life Histories and Social Change. Irish Journal of Sociology, 25(2): 207-213.

Gray, J., Geraghty, R. and Ralph, D. (2013) Young grandchildren and their grandparents: continuity and change across four birth cohorts. Families, Relationships and Societies, (2)2: 289-298.

Neale, B. (2019). What is Qualitative Longitudinal Research? London: Bloomsbury Academic.

Savage, M. (2005). Revisiting classic qualitative studies. Historical Social Research/Historische Sozialforschung, 118-139.

Guest post#22: Dr Emily Stapley: Analysing young people’s experiences of coping with problems, difficult situations and feelings: An evolving approach to analysing qualitative longitudinal evaluation data

Dr Emily Stapley contributes today’s guest post. Emily is a Qualitative Research Fellow in the Evidence Based Practice Unit (EBPU) at the Anna Freud National Centre for Children and Families and UCL. EBPU is a child and youth mental health research and innovation unit.

The blog focuses on some of the ways in which Emily and her colleagues are approaching the analysis of interview data from a five-year qualitative longitudinal (QLR) study. The work is part of the evaluation of HeadStart; a five-year, £56 million National Lottery funded programme set up by The National Lottery Community Fund to explore and test new ways to improve the mental health and wellbeing of young people aged 10 to 16 and prevent serious mental health issues from developing. Six local-authority-led partnerships in Blackpool, Cornwall, Hull, Kent, Newham and Wolverhampton are working with local young people, schools, families, charities, and community and public services to make young people’s mental health and wellbeing everybody’s business.

Analysing young people’s experiences of coping with problems, difficult situations and feelings: An evolving approach to analysing qualitative longitudinal evaluation data

The aim of our study is to explore young people’s experiences of coping with and receiving support for problems and difficult feelings or situations over a five-year period. The young people invited to take part in our study were those who were already receiving support from HeadStart or those who might do so in the future. Participants were in Years 5 or 7 at school (age 9 to 12) at the start of the study and (we hope!) will continue to be involved until they are in Years 9 or 11 (age 14 to 16). Working with two colleagues in the EBPU and at the University of Manchester (both of whom are PhD students), we are conducting semi-structured interviews once a year with approximately 80 young people (10 to 15 at each HeadStart partnership).

I decided to conduct a cross-sectional thematic analysis of the interviews in the first year, drawing on Braun and Clarke’s (2006) methodology. This decision was made in the context of the fact that:

  1. We were working with such a large dataset (82 interviews);
  2. We had always intended to present the themes arising across the dataset in the first year of the project, as a baseline report for the study as a whole (see Stapley and Deighton, 2018).

We took a team approach, using the qualitative data analysis software package NVivo (v11) to facilitate our analysis of the wave 1 dataset. As part of this process, I initially developed a thematic framework relating to our research questions by coding 80% of the interview transcripts. This involved giving brief labels to the extracts of the interview transcripts that related to our research questions, which described the content of the extracts, and then grouping all extracts with similar labels or codes together to form themes. The other two members of our team then each coded the remaining 20% of the transcripts using my thematic framework. This resulted in refinements and additions being made where necessary to the thematic framework.

At the outset of the study, we made a pragmatic decision to analyse the data drawing on the interviews across the HeadStart partnerships, rather than to conduct individual pieces of partnership-specific analysis. This speaks to our remit as the HeadStart Learning Team responsible for the national evaluation of the programme, whereas site-specific qualitative data collection and analysis is being conducted locally by the individual partnerships. However, we did explore which themes from our analysis described above could be seen specifically in the interviews from each partnership (i.e. across all of the interviews in a given partnership, which themes from our thematic framework were present and which were not?). There was relatively little variation between the partnerships, in terms of the themes from our thematic framework that could be seen specifically in their interviews. Ultimately, any decision to bring together the national and locally-collected qualitative datasets will be influenced by the degree of heterogeneity in our aims/research questions, our capacity, and the instigation of appropriate data sharing agreements.

Following our initial analysis of the wave 1 dataset, we had a decision to make in the second year about how to conduct diachronic analysis across waves 1 and 2. Sources such as Grossoehme and Lipstein (2016) have been helpful in thinking about this. We are currently planning to use typology methods, such as ideal-type analysis, to explore the patterns or ‘types’ evident in the young people’s experiences and perspectives, and the potential shift in this across the two years. For instance, do the young people (individually and in general across the sample) exhibit different patterns of coping behaviour and support use in the second year of the study, as compared to the first year, and why? What are the mechanisms or factors behind changes in the young people’s wellbeing across the first and second years of the study? The ideal-type analysis process typically begins by the researcher(s) writing a ‘case reconstruction’ of each interview, in our case a summary of the content of each transcript. These case reconstructions are then systematically compared with each other by the researcher(s), which leads to the formation of a number of broadly similar groups of case reconstructions or, in other words, interviews representing similar types of experience (e.g. Stapley et al., 2017).

We are now about to go into wave 3, our third year of data collection, and are really looking forward to seeing our participants again, as they grow older and have new experiences, opinions and perspectives. The growing size of the dataset as we accumulate more interviews each year means that establishing clear baselines in our analysis at the outset of the study will be important to direct our focus over the course of the study. At this early stage, I would envisage our analytic approach evolving over time, depending on the findings from our analysis at each wave and the topics raised by the young people during data collection.

References

Braun, V. and Clarke, V. (2006). Using thematic analysis in psychology. Qualitative Research in Psychology, 3, 77-101.

Grossoehme, D. and Lipstein, E. (2016). Analyzing longitudinal qualitative data: The application of trajectory and recurrent cross-sectional approaches. BMC Research Notes, 9, 1-5.

Stapley, E. and Deighton, J. (2018). HeadStart Year 1: National Qualitative Evaluation Findings – Young People’s Perspectives. London: CAMHS Press.

Stapley, E., Target, M., and Midgley, N. (2017). The journey through and beyond mental health services in the United Kingdom: A typology of parents’ ways of managing the crisis of their teenage child’s depression. Journal of Clinical Psychology, 73, 1429-1441.


Guest post#21: Dr Sarah Lewthwaite: Working in collaboration to develop the teaching of big qual analysis

Dr Sarah Lewthwaite, Research Fellow in the ESRC National Centre for Research Methods (NCRM) and Southampton Education School, University of Southampton, contributes today’s guest post. Sarah has expertise in the learning and teaching of advanced research methods, as well as, the intersections between critical theory, accessibility, new technologies and student experience in higher education.

In this blog, Sarah draws on a recent NCRM collaborative project – Big Qual Analysis: Innovation in Teaching and Method – which sought to advance the capacities of researchers who work with archived qualitative material from multiple data sets and of trainers who deliver the teaching of research methods.

Sarah and her colleague Prof Melanie Nind worked with the Big Qual team to build capacity in the learning and teaching of our breath-and-depth method for big qual analysis. Sarah discusses some of the steps we took to collaborate in our pedagogic development.

Working in collaboration to develop the teaching of big qual analysis

Research teams increasingly collaborate across complex divides. Working in geographically distributed, interdisciplinary and cross-functional teams can be challenging – particularly in areas of methodological innovation, such as big qual. Added to this, the impetus to build research capacity in cutting-edge methods can mean research teams become teaching teams. Collaborating as a teaching team adds complexity, in several key areas.

Traditionally, research methods teaching has lacked ‘pedagogical culture’, with an absence of resources, research and discursive material that methods teachers can draw upon to develop teaching. This matters because methods are pedagogically distinctive in the social sciences. Learners require theoretical understanding, procedural knowledge and technical skill (Kilburn, Nind and Wiles 2014), as well as an ability to put forward a method whilst simultaneously subjecting that method to sustained scrutiny (Bourdieu 1992). Methods education can also be characterised by a focus on teaching with and through data (Lewthwaite and Nind 2016). Such requirements demand certain pedagogic responses – fostering reflexivity, learning by doing, and so forth. Experiential learning has been cited as the ‘signature’ pedagogy of qualitative research; however, when conducting research with archives, ‘experience’ and notions of the ‘field’ are redefined. This gestures to particular ‘pedagogic content knowledge’ (or PCK), (Shulman 1986) – the pedagogic specificity – of working with archives and big qual analysis, amongst qualitative methods. Collaborating to develop PCK for big qual analysis from scratch is a challenge. Whilst acknowledging that context, learners, and different modes of teaching all impact on PCK, to begin to answer this challenge, we found the following steps useful in facilitating joint working.

1. Develop shared pedagogic language

Advanced research methods are frequently taught by content experts; researchers who may not have a background in education. As a result, talk about pedagogy may not come easily. To facilitate conversations, we worked with the Big Qual team to develop a 2-page glossary of pedagogic terms (Lewthwaite and Nind 2018), offering definitions of salient pedagogies with which to work. Beginning these conversations, teams may find that they have already invested methodological language with pedagogy, in methodological writing, conference presentations and seminars. With tools for dialogue, such implicit pedagogic knowledge can be more readily made explicit. These are verdant starting points for teaching teams.

2. Sequence content

The Big Qual team employed a metaphor for a ‘breadth-and-depth’ method for big qual analysis (Davidson, Edwards, Jamieson and Weller 2019) dividing the method into four steps. This sequenced approach provided a useful framework both for the ordering and chunking of content in class, and the division of labour for the teaching team, in planning and delivery. Importantly, in practice this raised three key issues. First, the necessity of stressing the whole of the method – and maintaining a logical, iterative thread that connects across the steps (e.g. the use of a worked example across the piece)– so a method isn’t reduced to its constitute parts. Second, orientating students within this framework, so they can understand at any given point where they are in the relation to the overview. Third, the importance of step-by-step annotated lesson plans. These detailed who was responsible for what, the timing and the nature of delivery at every stage. In a distributed team, where physical planning meetings are difficult, annotated lesson plans, and the sharing of presentation slides and notes, handouts and materials (linked below), were crucial to the team as a whole for grasping what would happen and when. As a shared teacher-resource, the lesson plan could then be developed after teaching, on the basis of team reflection and student feedback, to see where improvements could be made.

3. Pedagogic dialogue and reflection

The sharing of materials gestures to how teaching might be done, but does not address potential pedagogic conflict amongst individuals within a team. Pedagogy evokes values and approaches, as well as discrete actions. To this end, it is useful to discuss as a team underlying assumptions concerning what the teaching will convey to learners. How and why are the team invested in these methods, or particular ways of teaching it? What is the team trying to articulate when they articulate the method? Will teaching be student-centred and dialogic? Will it call upon learner expertise? To this end, dialogue and reflection on teaching is essential to the development of coherent team-teaching. Innovative methods frequently rely upon incremental advance rather than revolution (Wiles, Bengry-Howell, Crow and Nind 2013), so drawing upon prior experience and teaching resources can offer a useful way into teaching, but these must be (re)purposed effectively to the task at hand. Using cycles of planning, action and reflection helps to develop teaching. Learning from each other (building a local pedagogical culture), through discussion, is essential. In our work, we proposed a typology of pedagogy for methodological learning, to facilitate discussion and draw out implicit and unreflected knowledge. This encourages teachers to reflect upon their teaching approaches, strategies, tactics and tasks (moving from an approach – how a teacher goes about their pedagogic work in a way that coheres around a theory, principles or a set of values to the operational, task level – what it is learners are required to do. See Nind & Lewthwaite, f/c). By attending to values in both pedagogy and method, teams are better equipped to address sticky questions. For example, when teaching with secondary data, particularly teaching and learning challenges are raised. Archives can be challenging for learners, being built predominantly for archiving – rather than teaching or learning. When getting learners ‘hands-on’ with an archive, should learners be able to generate or apply their own (authentic) search terms to the archive? Or should teachers supply a tried-and-tested route through Search? A learner-generated search approach may be more engaging, being authentically connected to a learners research interests. However, the search may not return any data. This is an authentic lesson in the potential frustrations of archival research, but it may disengage students from the method at an early stage. Alternatively, teacher-guided search can ensure students can access and navigate data, but without offering a ‘teachable moment’ regarding the difficulty of archival search. By considering team values – such sticky issues can be evaluated for more informed pedagogic decision-making. Is authentic and experimental learning foremost? Or is modelling, exposition and demonstration paramount at an early stage? Do the team want to prioritise student-centred, or teacher-led approaches? How and when should these change?

This is one of the pedagogic issues specific to big qual analysis that will arise in teaching (another example gravitates around learner diversity – how to bridge the divergent qualitative and quantitative understandings). However, by using active and reflexive approaches to pedagogic development in dialogue, as a team, team-teaching can be hugely beneficial. Come together to debrief after teaching. Collect meaningful student feedback for team reflection. Look for ways to smooth transitions between teachers, and broker more communal pedagogic content knowledge. Feeding into and out of this process is an impetus to share your approaches, strategies, tactics and tasks with peers and wider teaching networks. We have sought to do this with the Teaching Big Qual Analysis: Innovation in method and pedagogy project. In this way, pedagogical culture can be built, to sustain methodological developments and build a resource base that wider publics can benefit from.

For other teaching resources stemming from the Big Qual Analysis – Innovation in Method and Pedagogy project, please visit: https://www.ncrm.ac.uk/resources/online/teaching_big_qual

References

Bourdieu, P. (1992) “The Practice of Reflexive Sociology (The Paris Workshop)”, in An Invitation to Reflexive Sociology, edited by P. Bourdieu and L. Wacquant, 217–260. Chicago: University of Chicago Press.

Davidson, E., Edwards, R., Jamieson, L. & Weller, S. (2019) Big data, Qualitative style: a breadth-and-depth method for working with large amounts of secondary qualitative data. Quality and Quantity. 53(363): 363-376.

Kilburn, D., Nind, M., and Wiles, R.A. (2014) “Learning as Researchers and Teachers: The Development of a Pedagogical Culture for Social Science Research Methods?.” British Journal of Educational Studies. 62(2): 191–207.

Lewthwaite S. and Nind, M. (2016) Teaching Research Methods in the Social Sciences: Expert Perspectives on Pedagogy and Practice, British Journal of Educational Studies. 64(4): 413-430.

Lewthwaite, S. and Nind, M. (2018) A glossary for methods teaching – NCRM quick start guide. Manual. NCRM.

Nind, M. and Lewthwaite, S. (f/c) A conceptual-empirical typology of social science research methods pedagogy. Research Papers in Education.

Shulman, L. (1986) Those who understand: knowledge growth in teaching, Educational Researcher. 15(2): 4–14.

Wiles, R., Bengry-Howell, A., Crow, G. and Nind, M. (2013) But is it innovation? The development of novel methodological approaches in qualitative research. Methodological Innovations Online. 8(1): 18-33.

Guest post#20: Dr Irmak Karademir Hazır: Tracing changes in notions and practices of child feeding: a trajectory approach to qualitative longitudinal research

Today’s guest post is written by Dr Irmak Karademir Hazır, Senior Lecturer in Sociology at the Department of Social Sciences, Oxford Brookes University, UK. In her post, Irmak outlines the trajectory approach she is currently using in her ethnographic and longitudinal research (BA/Leverhulme SRG) looking at the practices of foodwork (eating, cooking and feeding) in families with small children across different social classes. Irmak’s research focuses on class cultures, embodiment, cultural tastes and hierarchies. She is also interested in using and teaching quantitative and qualitative research methods and has used mixed methods designs with various combinations in her research so far (e.g. Cultural Distinctions, Generations and Change).

Tracing changes in notions and practices of child feeding: a trajectory approach to qualitative longitudinal research

I am using qualitative longitudinal research (QLR) to explore how families with young children (1.5 to 4 years old) organise and negotiate eating/feeding practices at home and beyond. The families I work with have different levels of economic, cultural, and temporal resources at their disposal and they all try to manage them to maintain an emotionally and nutritionally rewarding food routine. My interviews have generated data that could be very interesting for a cross-sectional analysis, demonstrating different notions of healthy eating/feeding and class-cultural distinctions in food socialisation. However, I am more interested in the element of change in this particular study. In what ways do a variety of factors (e.g. parents’ return to work; arrival of a new sibling; information received from professionals, social media, or the baby food industry) shape the period in which young children embody new food habits? What happens to adults’ eating practices when they have new family members (e.g. changes in the gender division of labour; experiences of commensality; acquisition of new cooking practices)? How do parents negotiate their feeding principles as children grow? To understand how these processes unfold in time, I use a trajectory approach in my analysis.

Since I visit my families every six months over two years, the data collection period of this study can be considered short for QLR. However, given that the topic is concerned with a very dynamic moment in couples’ lives, the distance between the time points works well. Inspired by Grossoehme and Lipstein’s approach (2016) to data analysis in medical QLR, I chose trajectory analysis as an analytical approach, as opposed to recurrent cross-sectional analysis. Trajectory analysis prioritises unpacking how an experience changes over time as well as the factors surrounding the case, rather than solely identifying the differences between two time points. It is advised that researchers use time-ordered displays (sequential matrices), which would permit an understanding of ‘what led to what’. To be able to employ trajectory analysis, the data collected from each stage should be coded individually first. After each stage, the themes are put into a matrix to show stability and change with time. As the example below shows, changes such as children starting school or a family’s decision to become vegetarian between two stages will influence their feeding principles, routines, and emotional responses. When the coding of three stages is completed, the matrix will show the trajectory of food parenting experiences (from introduction of solids to school age) around the key themes identified.

What makes my analysis different from other QLR that I have read so far is that each stage of data collection in my fieldwork focuses on a different aspect of food practice (provision, preparation, management), and this, I think, complicates the analysis. The first stage of data collection took place in the homes of families, where we prepared food and in most cases ate together. In the analysis of this stage, I looked for themes explaining families’ notions of good feeding/eating and how they organised their resources to enact and transfer these routines to their children. In the second stage, we went out food shopping together and talked about their preferences as I observed their food provisioning routines. Thus, each disposition that I identified in the analysis corresponded to a different set of practices in each stage, related to the provision, preparation, or emotional management of food work. As the example below shows, the practice extracted from the first time point to demonstrate a theme is usually related to preparation and cooking, whereas for the second time point the examples come from the shopping experience (i.e. provisioning). However, all examples are linked to the theme identified and show the trajectory of the dispositions/practices.

Thomson (2007) suggests that there are two aspects of longitudinal qualitative data analysis: the first is the longitudinal aspect of individual cases and the second is cross-sectional differences of structural context. She argues that in the analysis, researchers should develop case histories and then bring them into conversation with each other by comparing their various themes. Since I am interested in how social class shapes foodwork/feeding work in families, I decided to adjust the matrix to help me see the second aspect that Thompson refers to: cross-sectional variations. To achieve this, I decided to colour-code each entry to indicate the level of economic and cultural resources of the family interviewed (e.g. green indicates that the family has high cultural capital/moderate economic capital). At the end of the three stages, the matrix will not only demonstrate how events unfolded for each individual family but also how similar processes are lived by families from different social classes.

Like in the case of all QLR, the amount of data that requires appropriate structuring is challenging, but I believe that a systematic trajectory analysis, supported by cross-sectional comparisons and a reflexive approach, will generate rich and insightful analysis.


Table 1 Sample family matrix

Thomson R. (2007). The qualitative longitudinal case history: practical, methodological and ethical reflections. Social Policy and Society 6(4), 571-582.

Grossoehme D. & Lipstein E. (2016). Analyzing longitudinal qualitative data: the application of trajectory and recurrent cross-sectional approaches. BMC Research Notes 9(1), 136


Guest post#19: Dr Elena Zaitseva: Navigating the landscape of qualitative data in surveys with automated semantic analysis

In today’s blog, Dr Elena Zaitseva, an Academic Research and Development Officer at the Teaching and Learning Academy, Liverpool John Moores University,  describes her search for a user-friendly instrument that enables researchers to get an overview of an entire data landscape. She uses the text analytics tool Leximancer to conduct automated semantic analysis of responses to open questions in surveys; data that often goes unanalysed.

Elena’s research interests are in the higher education student experience, learner identity and learner journeys.  She has been using the semantic analysis software Leximancer for analysis of large qualitative data sets since 2011. Outcomes of this research are published in the Quality in Higher Education Journal, several book chapters and in two reports commissioned by the Higher Education Academy (now Advance HE).

Navigating the landscape of qualitative data in surveys with automated semantic analysis

Reflecting on the quantitative-qualitative divide in large scale survey data almost twenty years ago,  Bolden and Moscarola (2000) concluded that free text comments (e.g. responses to open questions in questionnaires) are ‘poorly utilised, either being totally ignored, analysed non-systematically, or treated as an aside’ (Bolden and Moscarola, 2000, p. 450). Two decades later and not much has changed.  Examining thousands of fragmented open question responses, varying from a short phrase or sentence to mini-narratives or lengthy reflective accounts, remains a complex, time and resource consuming exercise for researchers. However, timely analysis of free text comments could help not only enhance understanding of quantitative results, but also reveal new discourses not necessarily anticipated by the survey’s creators.

As part of a Higher Education Funding Council for England (HEFCE) funded project on the ‘Sophomore Slump’ that investigated disengagement and underperformance of second year university students, we undertook a comparative analysis of comments provided in a student survey deployed at each level of study (comparing themes from year one, two and final year students’ feedback) (Zaitseva et al, 2013). Each data set comprised, on average, 250 pages of text – single spaced Times New Roman 12 point font.

My search for a user-friendly instrument that would allow us to instantly see the whole institutional landscape of student feedback for each level of study, and be able to detect differences and drill down into the particular areas or topics, led me to Leximancer – a tool for visualising the conceptual and thematic structure of a text, developed at the University of Queensland (Smith and Humphreys, 2006).

The software automatically identifies concepts, themes (clusters of concepts) and connections between them by data mining the text, and visually representing the findings in the form of a concept map – a process called unsupervised semantic mapping of natural language. Based on an assumption that a concept is characterised by words that tend to appear in conjunction with it, the software measures how relevant one word is to a set of other words.  Only words that pass a certain relevance weight threshold, established by the software, form concepts, although this parameter can be manually adjusted (Fig 1).

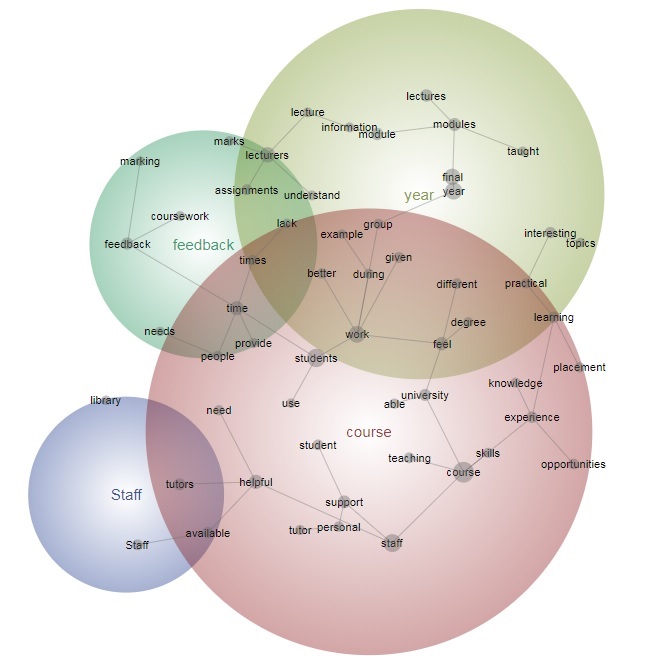
Figure 1. Example of a concept map generated by Leximancer

The tool not only determines the key concepts, themes and associated sentiments, but also provides useful information about the proximity of the concepts and their location. This is particularly beneficial for longitudinal and comparative analysis where underlying differences can be identified from the positioning of concepts on the map.

Although the ‘mapping’ process is completed automatically, making sense of the map and establishing meaning behind each concept is the researcher’s task. The researcher has to ‘dissect’ the concepts and associated themes by exploring all instances (direct quotes) that contributed to the concept’s creation, and undertake a more traditional interpretive/thematic analysis.

Using Leximancer in the ‘Sophomore Slump’ research helped uncover change in student attitudes and priorities as they progressed with their studies, showing how they moved from affectively oriented goals in the first year to a second year’s learning and goal reaffirmation stage, and achievement and outcome-oriented learning in the final year.

Another research project where the capabilities of Leximancer were tested, was analysis of free text comments of postgraduate taught students at the sector level to identify the dominant themes within their feedback (Zaitseva and Milsom, 2015). The Postgraduate Taught Experience Survey (PTES) dataset included responses of 67,580 students from 100 higher education institutions. The survey provided the opportunity to comment after each section (seven in total), and invited responses on the most enjoyable aspects as well as how the course experience could be improved. The overall data set comprised around 2,670,000 words which was the equivalent of 5933 pages (single spaced Times New Roman, 12 point font). An attempt to generate a concept map from a combined data set resulted in a densely populated map and thousands of quotes attached to each concept, so it was deemed unsuitable for analysis. The data had to be disaggregated by analysing responses from each section separately, and augmented by insights from the demographic data breakdown (e.g. looking at trends in responses of young and mature, part-time and full-time students) to be able to achieve at least some saturation in thematic exploration.

The analysis identified a number of new themes, including the heavy workload of part-time students which was often underrepresented in course-related marketing information, and its impact on student mental health and ability to achieve (Fig 2.); issues around ‘levelness’ of Masters programme delivery which, in some cases, was aimed at doctoral level and, in other cases, at final year undergraduate degree, and some other.

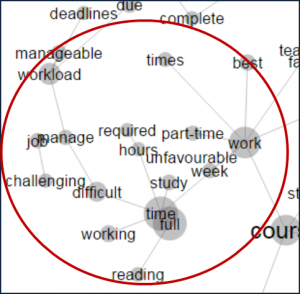
Figure 2. A fragment of part-time student experience concept map

Instruments such as Leximancer allow researchers to conduct analysis of large qualitative data sets in a time-efficient and consistent manner, as data pre-processing is done by computer. The concept map that emerges from this analysis captures ‘the wisdom of crowds’ (Dodgson et al. 2008) and is a text-driven, not a researcher-driven representation. But the researcher is able to interrogate the concept map and perform a more focused/tailored analysis by mining the text for ‘deeper contextual associations’ (Stewart and Chakraborty, 2010). The vaster the data source, the more nuanced the concept map will be.

Use of computer aided analysis increases reliability (as the top level of analysis is independent of the researcher’s effect), and facilitates reproducibility of the findings as it is possible to retrace your thinking that may have contributed to the emergence of new ideas and research findings.

There are limitations to this type of analysis. Some concepts emerge strongly where they are represented by a narrow vocabulary. In the context of student surveys, words such as lecture, library, feedback or exams will have a strong presence on the concept maps. In contrast, other elements of student experience, such as personal development or extracurricular activities, will be identified from a broader pool of terms and have a greater likelihood of being diluted as a concept in the map. This can be mitigated by undertaking a tailored analysis, for example, through concept seeding, by adding concepts that have not passed publication threshold, but are of interest to the researcher.

Some concepts are relatively fixed in their meaning, while others are very broad. For instance, the concept tutorial is most likely to represent a single meaning in student feedback. At the same time, the concept work, being noun as well as a verb, might have multiple meanings. To fine-tune the analysis, more specific queries should be run to better understand all connotations related to the concept (e.g. group + work, part-time+ work).

Sentiment analysis needs to be occasionally verified by checking contextual understanding, but Leximancer also mitigates this by providing both indicators (favourable and unfavourable probability).

Without any doubt there are limits to what the software analysis can achieve. Complexity of language implies that automated semantic analysis methods will never replace careful and close reading of the text, but ‘computer assisted methods are best thought of as amplifying and augmenting careful reading and thoughtful analysis’ (Grimmer and Stewart, 2013, p. 2). These methods are vital to handling large volumes of qualitative data that might otherwise go un-analysed.

References

Bolden, R. and Moscarola, J. (2000) Bridging the Quantitative-Qualitative Divide: The Lexical Approach to Textual Data Analysis, Social Science Computer Review, 18(4): 450-460.

Grimmer, J. and Stewart, B. (2013) Text as Data: The Promise and Pitfalls of Automatic Content Analysis Methods for Political Texts, Political Analysis Advance Access, 1-31, available online:  https://web.stanford.edu/~jgrimmer/tad2.pdf

Smith, A. and Humpreys, M. (2006) Evaluation of Unsupervised Semantic Mapping of Natural Language with Leximancer Concept Mapping, Behavioural Research Methods, (38): 262–79

Stewart, G. and Chakraborty, A. (2010) Strategy Content Analysis for Service Identification: A Case Study on Government Agencies. 5th Conference on Qualitative Research in IT, Brisbane, available online:  https://researchonline.jcu.edu.au/25633/1/QUALIT10.pdf

Zaitseva, E., Milsom, C. and Stewart, M. (2013) Connecting the Dots: Using Concept Maps for Interpreting Student Satisfaction. Quality in Higher Education, 19(2): 225–47.

Zaitseva, E. and Milsom, C. (2015) In their own words: Analysing students’ comments from the Postgraduate Taught Experience Survey, York: Higher Education Academy, available online: https://www.heacademy.ac.uk/knowledge-hub/postgraduate-taught-experience-survey-2015